|
Mazinsa distributes and markets in America, Europe and Asia: sardine and tuna fish meal, fish oil and soluble (GMP + IFFO + MSC)
Weekly movements of fishmeal and fish oil (Norway, China, Peru) - W41
 WORLDWIDE WORLDWIDE
Friday, October 18, 2019, 17:00 (GMT + 9)
FISH MEAL
Through week 41, 585,830 tonnes of fish were destined for reduction at an average price of NOK 2.90/kg, down 16% on those destined for such purpose during the same period in the previous year.
Table 1: Catch volumes destined for fishmeal and fish oil production, Norway, 2018/2019, in tonnes
|
Species
|
Tonnes 2019
|
Tonnes 2018
|
Variation %
|
|
Herring
|
54.751
|
45.453
|
+20%
|
|
Blue whiting
|
348.011
|
452.724
|
-23%
|
|
Sandlance
|
7,725
|
12.436
|
-38%
|
|
Capelin
|
2
|
97,305
|
-100%
|
|
Small sandeel
|
124,509
|
68,548
|
+82%
|
|
Norway pout
|
44,138
|
14,295
|
+209%
|
|
Others
|
6,694
|
4,753
|
+41%
|
|
Total
|
585,830
|
695,514
|
-16%
|
Source: Norges Sildesalgslag/FIS.com
Prices and markets
China
At the beginning of week 42, inventories registered 242,000 tonnes. Volumes leaving the warehouses amounted to almost 41,000 tonnes during the preious week
Table 2: Average price of fishmeal at the main Chinese ports 2019, in RMB/t
|
Quality
|
Price (RMB/t)
|
|
Week 41
|
Week 39
|
|
FAQ 65%
|
9,000
|
9,000
|
|
SD 68%
|
9,900
|
9,900
|
Source: FIS.com
Graph 1: Weekly average prices of fish meal FAQ in the main ports of China, 2015/2019, in RMB/t
.png)
Source: FIS.com
Graph 2: Average weekly prices of SD fishmeal in the main ports of China, 2015/2019, in RMB/t
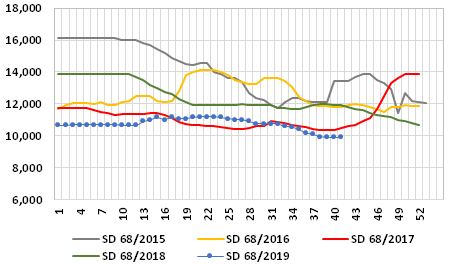
Source: FIS.com
Graph 3: Evolution of the weekly average prices of fishmeal in the main ports of China, 2015/2019, in RMB/t
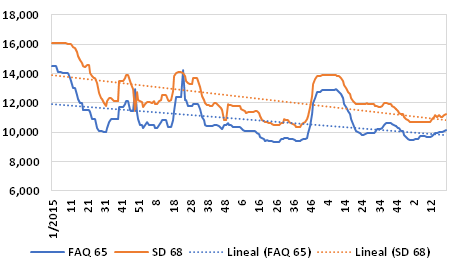
Source: FIS.com
Table 3: Price of white fishmeal, RMB/t, 2019
|
Quality
|
Origin
|
Price (RMB/t)
|
|
Week 41
|
Week 39
|
|
65-66%, produced on board
|
USA
|
13,000
|
13,000
|
|
58-60%,
|
Russia
|
10,600
|
10,600
|
Source: FIS.com
Peru
Table 4: Average prices of Peruvian fishmeal, in USD/t FOB, 2019
|
Quality
|
Average FOB price USD/t
|
|
Week 42
|
Week 41
|
|
SD 68/10/10/4(1)/120/7.5/500
|
1,300
|
1,300
|
|
SD 67/10/10/5(2)/120/10/1000
|
1,250
|
1,250
|
|
SD 67/10/10/5(2)/120/10
|
1,200
|
1,200
|
|
SD 67/10/10/5(2)/150/10
|
1,150
|
1,150
|
|
FAQ 66/12/10/5/2
|
1,090
|
1,090
|
|
FAQ 65
|
1,040
|
1,040
|
Source: FIS.com
Other origins
Chilean 67% fishmeal is at USD 1,520 and that produced in Iceland, 70%, at USD 1,770, both FOB Germany.
FISH OIL
Peru
Raw fish oil is at USD 1,850/t.
Table 5: Prices of fishoil, Peru, 2019, in USD/t
|
Oil
|
Packaging
|
Incoterm
|
Week 42
|
Week 41
|
|
Fish oil, raw
|
Bulk
|
FOB PI Peru
|
1,850
|
1,850
|
|
Fish oil, raw
|
Barrels, FCL
|
FOB PI Peru
|
1,900
|
1,900
|
|
Fish oil, raw
|
Flexitank, FCL
|
FOB PI Peru
|
2,000
|
2,000
|
|
Fish oil, omega 3 guaranteed (28% EPA/DPA)
|
|
FOB PI Peru
|
2,200
|
2,200
|
Source: FIS.com
editorial@seafood.media
www.seafood.media
|
|


 Print
Print