|
EU seafood consumption marginally increased in 2018
 EUROPEAN UNION EUROPEAN UNION
Monday, December 16, 2019, 00:00 (GMT + 9)
AIPCE-CEP, an organizacion composed by the EU Fish Processors and Traders Association and the European Federation of National Organizations of Importers and Exporters of Fish, has released a new edition of its Finfish Study.
The European fish and seafood added value processing industry relies on a consistent and sustainable supply of raw materials to satisfy consumer demand for fish products, both for domestic and out-of-home markets. AIPCE-CEP and its members prepare the Finfish Study to use at EU and member state level to exemplify the need for imported seafood, particularly whitefish, in the production of added value seafood within Europe. The ability to rely on a continuous, sustainable supply of raw materials is a key factor in maintaining and allowing expansion of employment and trade opportunities generated by the fish and seafood processing industry in Europe.
AIPCE-CEP comprises twenty EU National Associations and two associations from third countries, and the sector that it represents account for more than 3,900 enterprises and 128,000 jobs.
Regarding EU seafood consumption and supply, the key findings of the new study include:
- Total market supply (EU-production + third countries imports) slightly grew to 15.08 million tonnes in 2018 (+0.8%)
- EU domestic supply for consumption marginally increased by 12 thousand tonnes to 5.66 million tonnes(+0.2%)
- Imports for consumption from third countries increased by 115 thousand tonnes to 9.42 million tonnes (+1.2%)
- Exports to third countries expanded by 5.3% to 2.23 million tonnes
- Total EU consumption (EU domestic supply + Imports –Exports) marginally increased to 12.85 million tonnes (+0.1%)
- Consumption per capita in the EU stabilized with 25,1 kg per capita in 2018
- EU import dependence rate fluctuates around 62-63% of total supply

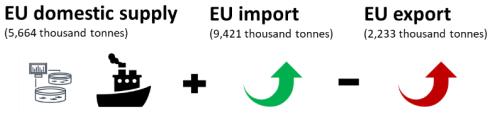
Food balance
The EU market is highly dependent on imported materials for its markets. EU domestic supplycannot fulfil the EU consumer demands on its own,either in volume or species diversity.
EU domestic supply
EU domestic supply consists of EU catches and EU aquaculture production. In 2018 80% of this supply came from EU catches (5.32 million tonnes), whereas aquaculture production reached 1.33 million tonnes. Part of EU catches are intended for non-food uses (fishmeal, fish oil; 987 thousand tonnes), which make the total EU domestic supply for food uses 5.66 million tonnes in 2018, an increase of 0.2% compared to 2017 (5.65 million tonnes).
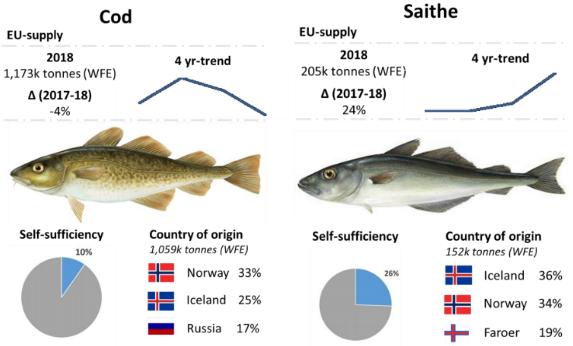
Cod: Most important countries for cod in 2018 were Norway (33%), Iceland (25%) and Russia (17%). Where cod volumes of Norway (-5%) and Russia (-11%) decreased, volumes of Icelandic cod increased (+11%) | Saithe: Most important countries for saithe in 2018 were Iceland (36%), Norway (34%) and Faroes Islands (19%). Where saithe volumes of Faroes Islands (-9%) decreased, volumes of Icelandic (+52%) and Norway (+34%) saithe increased
Imports from third countries
Import activity has risen to 9.42 million tonnes, an increase of 115 thousand tonnes compared to 2017 (+1.2%).
Imports from third country are essential to increase the available fish volumes and fish diversity in the EU. This puts 2018 about 3.9% above the average since 2010.
.jpg)
Hake: Most important countries for hake in 2018 were Namibia (38%), South Africa (17%), Argentina (15%) and USA (14%). Where hake volumes of Argentina (-10%) decreased, volumes of Namibian (+5%), South African (+13%) and USA (+36%) hake increased | Alaska Pollock: Most important countries for Alaska pollock in 2018 were USA (40%), China (40%) and Russia (19%). Where Alaska -pollock volumes of USA (-2%) decreased, volumes of China (+2%) and Russian (+45%) Alaska pollock increased
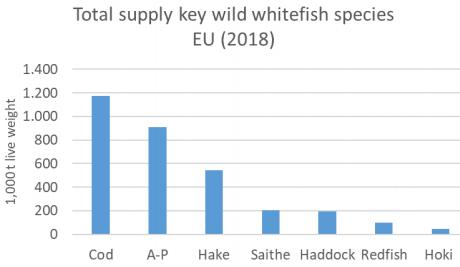
Total supply
Total supply for consumption in the EU is based on the available fish products (food use) gathered from domestic supply and imports from third countries together. The total supply breached the 15 million tonnes level, growing to 15.09 million tonnes in 2018 (+0.8%)
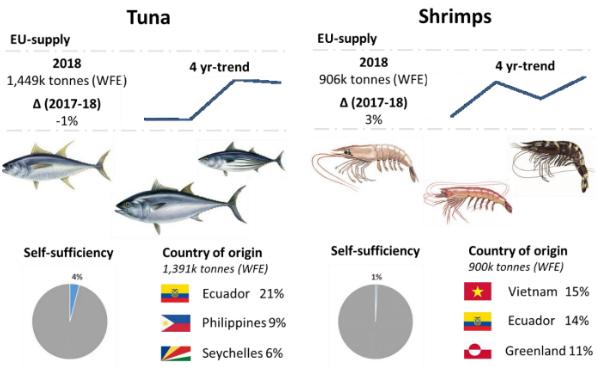
Tuna: Import volume decreased to 1,391 thousand tonnes in 2018 (-1%). Most important country for tuna in 2018 was Ecuador (21%), followed by Philippines (9%) and Seychelles (8%). Ecuadorian tuna benefit from free trade agreement between EU and Ecuador | Shrimp: Import volume increased to 900 thousand tonnes in 2018 (+3%). Most important country for shrimp in 2018 were Vietnam (15%; Pacific white shrimp & Black tiger shrimp), Ecuador (14 %; Pacific white shrimp ), Greenland (11%; North -Atlantic cold water shrimp ), Argentina (11%; Argentine red shrimp ) and India (10%; Pacific white shrimp).
Exports to third countries
Export activity has risen to 2.23 million tonnes in 2018, an increase of 112 thousand tonnes compared to 2017 (+5.2%). Exports represent around 39% of the total EU domestic supply (food use). The assumption is that exports are of EU domestic origin fish rather than re-export of materials. This puts 2018 about 7.9% above the average since 2010.
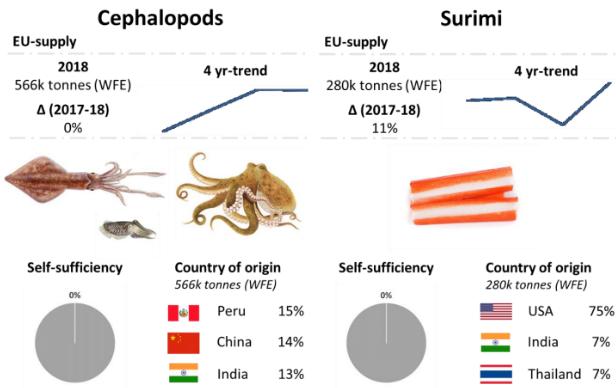
Most important countries for cephalopods in 2018 were Peru (15%), China (14%) India (13%) and Falkland Isles (13%) | Main surimi processors in the EU are France, Spain and Lithuania. Frozen surimi was responsible for 84% of the surimi imports.
Total consumption
The net result of domestic supply, import and export gives a calculated consumption of total 12.85 million tonnes, a marginal increase of 15 thousand tonnes (+0,1%). After making some restatement for last year this is the second highest level since EU27/28 was formed and confirms the long term for fish consumption to be rising. The consumption was 3.6% above the average since 2010.
editorial@seafood.media
www.seafood.media
|


 Print
Print