| |

This report deals with pelagic species catch volumes for human consumption in waters of Japan and Iceland. It also tackles aspects such as prices, markets, exports and imports of species hereinafter detailed in the index.
1. ASIA
1.1 Japan
Herring roes
Prices
The average price of salted herring roes imports (HS 030520010) was JPY 963/kg in April, up 71% on that of March and down 2% on that of April 2018. During the first four months, it averaged JPY 886/kg, down 5% on that of the same period in the previous year.
Graph 1: Average price of herring roes at Customs, HS 030520010, 2015/2019, in JPY /kg
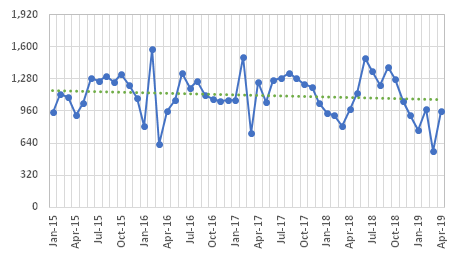
Source: Japanese Customs
Markets
Imports of salted of herring roes (or dried), HS 030520010, reached 78 tonnes in the month analysed, worth JPY 75 million CIF at Japanese Customs, up 48% in volume and 153% in value than that imported in March and down 52% in volume and 53% in value on those of April 2018.
Graph 2: Japanese imports of herring roes, HS 030520010, 2015/2019
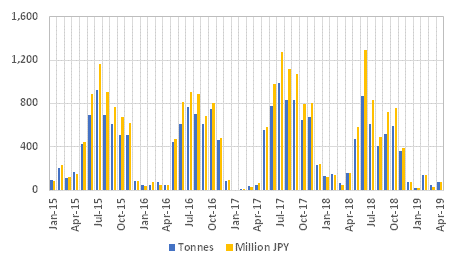
Source: Japanese Customs
In the first four-month period of the year, imports totalled 296 tonnes and JPY 268 million, down 41% in volume and 54% in value on those of the same period in 2018.
The main supplier of herring roes of HS 030520010 was Russia during the period, with 123 tonnes and JPY 114 million.
Graph 3: Main origins of herring roes imports, HS 030520010, January-April 2019, in tonnes
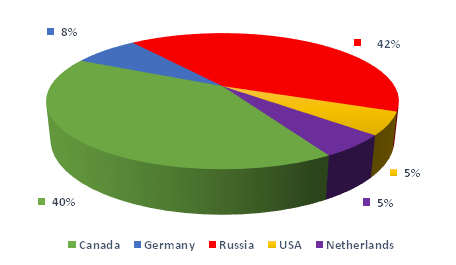
Source: Japanese Customs
Back to index
2. EUROPE
2.1 Iceland
Capelin (Mallotus villosus)
Prices
Table 1: FOB price of Icelandic capelin exports, USD / kg FOB, 2019-2018
|
Destination
|
Apr/19
|
Apr/18
|
Variation % Apr/19 Apr/18
|
|
Japan
|
1.75
|
2.17
|
-20%
|
|
China
|
2.35
|
1.73
|
36%
|
|
Belarus
|
-
|
-
|
-
|
|
Holland
|
0.61
|
2.31
|
-74%
|
|
Total
|
2.06
|
1.92
|
7%
|
Source: FIS.com
Markets
In the first four-month period of the year, exports reached 5,168 tons and USD 5,292,001, 48% less in volume and 53% less in value in relation to the same period last year.
Table 2: Icelandic capelin exports, 2019-2018, tonnes and USD FOB thousands (including land plants and vessels)
|
Destination
|
Jan-Apr 2019
|
Jan-Apr 2018
|
Variation % 2019/2018
|
|
Tonnes
|
Value (thousands of USD
|
Tonnes
|
Value (thousands of USD
|
Tonnes
|
Thousands of USD
|
|
Japan
|
454
|
632
|
2,118
|
4,029
|
-79%
|
-84%
|
|
China
|
859
|
1,215
|
2,265
|
3,640
|
-62%
|
-67%
|
|
Belarus
|
1,766
|
1,289
|
1,555
|
1,335
|
14%
|
-3%
|
|
Holland
|
508
|
705
|
283
|
1,458
|
80%
|
-52%
|
|
4 first
|
3,587
|
3,841
|
6,221
|
10,463
|
-42%
|
-63%
|
|
Others
|
1,581
|
1,452
|
3,944
|
790
|
-60%
|
84%
|
|
Total
|
5,168
|
5,292
|
10,165
|
11,252
|
-49%
|
-53%
|
Source: FIS.com
Back to index
By DGA
www.fis.com
|


 Print
Print