| |

This report deals with pelagic species catch volumes for human consumption. It also tackles aspects such as prices, markets and exports of species hereinafter detailed in the index.
INDEX
1. ASIA
1.1 Japan - Mackarel
2. EUROPE
2..1 Iceland – Capelin
1. ASIA
1.1 Japan
Mackerel
Prices
The average price of frozen mackerel (HS 030354000) was JPY 270/kg at Japanese Customs in June, down 5% on that of May and up 17% on that of June 2018. During the first six months, it averaged JPY 254/kg, up 20% on that of the same period in the previous year.
Graph 1: Average price of frozen mackerel at Customs, HS 030354000, 2015/2019, in JPY/kg
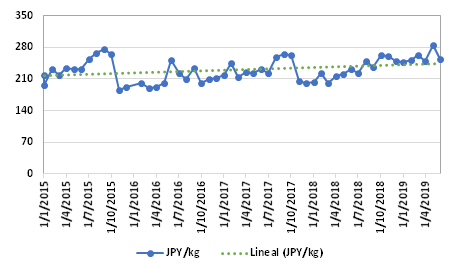
Source: Japanese Customs/FIS.com
Table 1: Average price of mackerel in japanese customs(HS 030354000), JPY/kg, 2017/2019
|
Origin
|
JPY per kg
|
Variation
|
|
Jun/19
|
May/19
|
Jun/18
|
Jun/19 May/19
|
Jun/19 Jun/18
|
|
Korea
|
290
|
357
|
-
|
-19%
|
-
|
|
China
|
256
|
310
|
262
|
-17%
|
-2%
|
|
Norway
|
289
|
283
|
228
|
+2%
|
+27%
|
|
United Kingdom
|
408
|
433
|
180
|
-6%
|
+127%
|
|
Ireland
|
218
|
235
|
190
|
-7%
|
+15%
|
Source: Japanese Customs
Markets
Japanese imports of mackerel (HS 0303.54.000) reached 2,760 tonnes, worth JPY 746 million CIF at Japanese Customs. These figures are down 10% in volume and 14% in value on those of the previous month and up 3% in volume and 20% in value on those of June 2019.
Graph 2: Japanese imports of mackerel (HS 030354000), 2015/2019
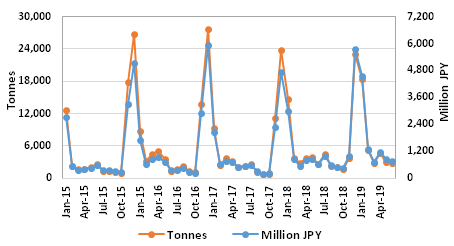
Source: Japanese Customs/FIS.com
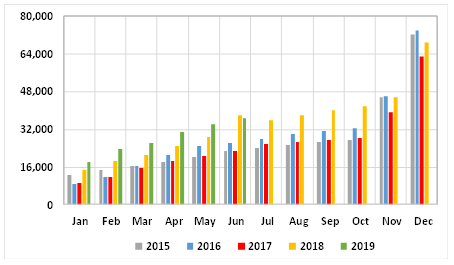
In the period, exports reached 36,780 tonnes and JPY 9,357 million, up 17% in volume and 40% in value compared to the same period of 2018.
Graph 3: Imports of frozen mackerel (HS 030354000), accumulated monthly, January-June, 2015/2019
Source: Japanese Customs/FIS.com
The 88% of imports of the year came from Norway, 27,242 tonnes.
Graph 4: Origin of Japanese imports of mackerel, (HS 030354000), January-June 2019, in tonnes
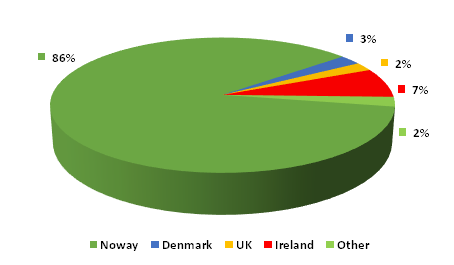
Source: Japanese Customs/FIS.com
Back to index
2. EUROPE
2.1 Iceland
Capelin (Mallotus villosus)
Prices
Table 2: FOB price of Icelandic capelin exports, USD/kg FOB, 2019/2018
|
Destination
|
Jun/2019
|
Jun/2018
|
Variation % 2019/2018
|
|
Japan
|
1.95
|
1.96
|
0%
|
|
China
|
2.27
|
1.77
|
+28%
|
|
Belarus
|
-
|
0.83
|
-
|
|
The Netherlands
|
-
|
1.60
|
-
|
|
Total
|
2.11
|
1.32
|
+61%
|
Source: FIS.com
Table 3: FOB price of Icelandic capelin roes exports, USD/kg FOB, 2019/2018
|
Destination
|
Jun/2019
|
Jun/2018
|
Variación % 2019/ 2018
|
|
Japan
|
11.62
|
8.22
|
+41%
|
|
China
|
10.58
|
9.43
|
+12%
|
|
United States
|
10.70
|
10.86
|
-1%
|
|
Taiwan
|
10.30
|
5.51
|
+87%
|
|
Total
|
10.67
|
5.21
|
+105%
|
Source: FIS.com
Markets
In the first semester of the year, exports of whole capelin reached 6,361 tonnes and USD 7,141,000, 62% less in volume and 68% less in value in relation to the same period last year.
Table 4: Icelandic whole capelin exports, 2019-2018, tonnes and USD FOB thousands (including land plants and vessels)
|
Destination
|
Jan-Jun 2019
|
Jan-Jun 2018
|
Variation % 2019/2018
|
|
Tonnes
|
Value (thousands of USD
|
Tonnes
|
Value (thousands of USD
|
Tonnes
|
Thousands of USD
|
|
Japan
|
942
|
1,572
|
4,344
|
7,743
|
-78%
|
-80%
|
|
China
|
1,035
|
1,564
|
3,705
|
5,959
|
-72%
|
-74%
|
|
Belarus
|
2,056
|
1,449
|
3,497
|
2,999
|
-41%
|
-52%
|
|
Netherlands
|
508
|
693
|
458
|
1,614
|
11%
|
-57%
|
|
4 first
|
4,541
|
5,278
|
12,004
|
18,315
|
-62%
|
-71%
|
|
Others
|
1,820
|
1,862
|
4,602
|
4,152
|
-60%
|
-55%
|
|
Total
|
6,361
|
7,141
|
16,606
|
22,467
|
-62%
|
-68%
|
Source: FIS.com
As for capelin roes, exports reach 6,361 tonnes and USD 5,657,000, 11% less in volume and 26% less in value compared to the same period last year.
Table 5: Icelandic capelin roes exports, 2019-2018, tonnes and USD FOB thousands (including land plants and vessels)
|
Destination
|
Jan-Jun 2019
|
Jan-Jun 2018
|
Variation % 2019/2018
|
|
Tonnes
|
Value (thousands of USD
|
Tonnes
|
Value (thousands of USD
|
Tonnes
|
Thousands of USD
|
|
Japan
|
625
|
4,378
|
1,377
|
5,946
|
-55%
|
-26%
|
|
China
|
478
|
3,841
|
1,105
|
5,570
|
-57%
|
-31%
|
|
Belarus
|
1,633
|
10,754
|
807
|
3,502
|
+102%
|
+207%
|
|
Netherlands
|
502
|
4,650
|
356
|
2,999
|
+41%
|
+55%
|
|
4 first
|
3,238
|
23,624
|
3,645
|
18,016
|
-11%
|
+31%
|
|
Others
|
2,419
|
15,501
|
2,704
|
13,157
|
-11%
|
+18%
|
|
Total
|
5,657
|
39,125
|
6,349
|
31,173
|
-11%
|
+26%
|
Source: FIS.com
Back to index
By DGA
www.fis.com
|


 Print
Print