|
Dried fish meal bag from TASA Peru
Situation and movements of fishmeal and fish oil | Norway, China, Peru (W30-32)
 WORLDWIDE WORLDWIDE
Saturday, August 10, 2019, 02:00 (GMT + 9)
In Norway, through week 30, they destined 513,707 tonnes of fish for reduction at an average price of NOK 2.78 /kg, down 20% on those destined for such purpose during the same period in the previous year.
Table 1: Catch volumes destined for fishmeal and fish oil production, Norway, 2018/2019, in tonnes
|
Species
|
Tonnes 2019
|
Tonnes 2018
|
Variation %
|
|
Herring
|
30,340
|
27,046
|
+12%
|
|
Blue whiting
|
340,323
|
443,092
|
-23%
|
|
Sandlance
|
940
|
216
|
+335%
|
|
Capelin
|
0
|
97,305
|
-100%
|
|
Small sandeel
|
124,509
|
68,548
|
+82%
|
|
Norway pout
|
16,210
|
7,630
|
+112%
|
|
Others
|
1,385
|
457
|
+203%
|
|
Total
|
513,707
|
644,294
|
-20%
|
Source: Norges Sildesalgslag/FIS.com
China
At the beginning of week 32, inventories registered 271,000 tonnes. Volumes leaving the warehouses amounted to almost 28,000 tonnes during the preious week.
Table 2: Average price of fishmeal at the main Chinese ports 2019, in RMB/t
|
Quality
|
Price (RMB/t)
|
|
Week 31
|
Week 30
|
|
FAQ 65%
|
9,950
|
9,950
|
|
SD 68%
|
10,750
|
10,750
|
Source: FIS.com
Graph 1: Weekly average prices of fish meal FAQ in the main ports of China, 2015/2019, in RMB/t
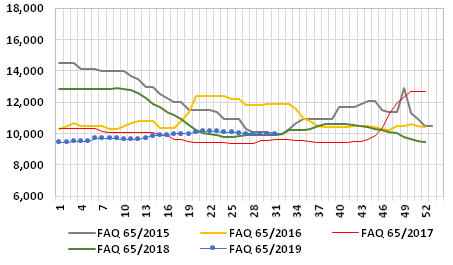
Source: FIS.com
Graph 2: Average weekly prices of SD fishmeal in the main ports of China, 2015/2019, in RMB/t
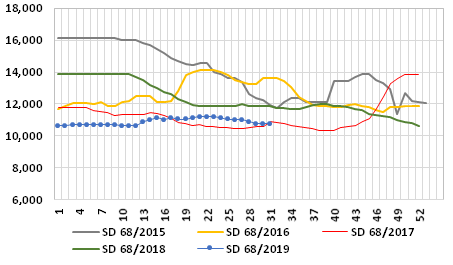
Source: FIS.com
Graph 3: Evolution of the weekly average prices of fishmeal in the main ports of China, 2015/2019, in RMB/t
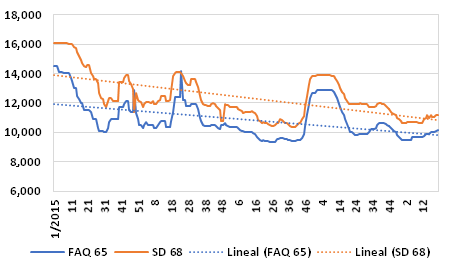
Source: FIS.com
Table 3: Price of white fishmeal, RMB/t, 2019
|
Quality
|
Origin
|
Price (RMB/t)
|
|
Week 31
|
Week 30
|
|
65-66%, produced on board
|
USA
|
13,600
|
13,600
|
|
58-60%,
|
Russia
|
10,800
|
10,800
|
Source: FIS.com
Peru
In the recently completed season, anchovy landings were around 2.05 million of tonnes. Data were also known about the inventory not yet sold in Peru, which would exceed 100,000 t. This, added to the important inventory in the main ports of China made the product offered about USD 50 below the previous week. Some operators even mentioned that businesses could be completed for USD 20 or 30 below those shown in the table.
Table 4: Average prices of Peruvian fishmeal, in USD/t FOB, 2019
|
Quality
|
Average FOB price USD/t
|
|
Week 32
|
Week 31
|
|
SD 68/10/10/4(1)/120/7.5/500
|
1,550
|
1,600
|
|
SD 67/10/10/5(2)/120/10/1000
|
1,500
|
1,550
|
|
SD 67/10/10/5(2)/120/10
|
1,450
|
1,500
|
|
SD 67/10/10/5(2)/150/10
|
1,400
|
1,450
|
|
FAQ 66/12/10/5/2
|
1,300
|
1,340
|
|
FAQ 65
|
1,230
|
1,280
|
Source: FIS.com
Other origins
Chilean 67% fishmeal is at USD 1,575 and that produced in Iceland, 70%, at USD 1,880, both FOB Germany.
Fish oil
Peru
Raw fish oil is at USD 1,850/t.
Table 5: Prices of fishoil, Peru, 2019, in USD/t
|
Oil
|
Packaging
|
Incoterm
|
Week 32
|
Week 31
|
|
Fish oil, raw
|
Bulk
|
FOB PI Peru
|
1,850
|
1,850
|
|
Fish oil, raw
|
Barrels, FCL
|
FOB PI Peru
|
1,900
|
1,900
|
|
Fish oil, raw
|
Flexitank, FCL
|
FOB PI Peru
|
2,000
|
2,000
|
|
Fish oil, omega 3 guaranteed (28% EPA/DPA)
|
|
FOB PI Peru
|
2,300
|
2,250
|
Source: FIS.com
editorial@seafood.media
www.seafood.media
|
|


 Print
Print